Chapter 1. From Idea to MVP
Linked repositories:
Introduction
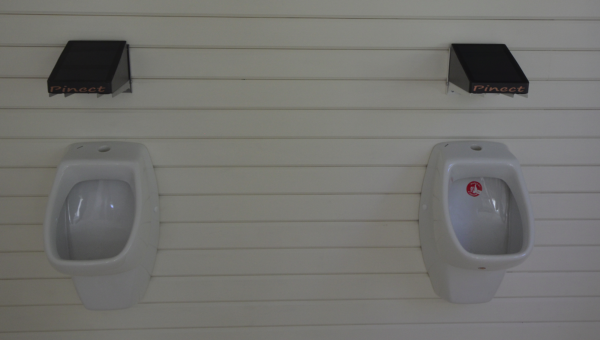
Let’s see how other urine game devices are built. Several designs have been produced to date, usually comprising a urinal fitted with a pressure sensor to measure the strength and position of the urine flow and an LCD screen mounted above the urinal to provide animated graphics. All these items are easy to get for an ordinary person, except the urinal fitted with a sensor. What a replacement for it could look like?
Throughout my quest, I experimented with a variety of sensors, including ultrasonic, infrared, and radio types. I was looking for a simple and cheaper solution. But I couldn’t find one. Any design required a more complex geometry setup. Depending on the geometry-based situation and possible scenarios in a specific reflective cover of the urinal, each device needs its own individual processing. This required careful sensor placement and the calculation of correction factors for each individual device. It was a time-consuming process and not exactly a turn-key solution for DIY makers and engineers.

Unfortunately, this solution wasn’t exactly turn-key, and wasn’t particularly accessible to DIY makers and engineers. I decided to try a different approach. I turned to computer vision and machine learning for image recognition, hoping to simplify the hardware and setup. This was a new area for me, and I knew it would present its own set of challenges. However, I was determined to find a solution that was more user-friendly and easier for others to implement.
However, I quickly ran into two main problems. The first was the lack of a dataset for this process. I tried to create one using a pump, surface, and camera, but the resulting dataset was insufficient.
The second problem was that the neural network was running slowly and requiring extreme computational resources. I had been hoping to use a cheap Android device like a smartphone or tablet for image processing, but it quickly became clear that this would not be possible. Using a camera as a motion sensor is a clever solution that can help solve the problem of accurate positioning. The wide-angle range and ability to be easily adjusted remotely are definitely attractive features for a motion sensor. These capabilities can allow the sensor to capture a large field of view, making it easier to track the movement of the player(gamer) stream.
However, in order to use the camera effectively, it is necessary to find how to fastly calculate the position of the gamer stream. The most cost efficient solution was to use partial image recognition over time. This approach involves analyzing changes in a specific part of the video data over time, rather than trying to process the entire image at once.
Using data from changes in the background of the camera image can be an effective way to detect the position of the gamer stream when the console, the pissoir and other objects in the scene are fixed in relation to each other. In this case, since only the gamer stream can move in the video, it becomes easier to detect their movement and use it to calculate their position. Simplifying the task by working with a part of the screen can also help to reduce the computational demands of the system, as it reduces the amount of data that needs to be processed. In the case of a pong game, it is sufficient to pin down the position of the gamer in the direction of the horizontal line, as this is all that is needed to play the game.
Using a 1D convolution to collect image changes along the axis can be a useful approach for detecting the movement of the gamer in a video. A 1D convolution is a mathematical operation that involves summing up the values of each column in an image. This can help to identify changes in the image data over time, which can be used to detect movement. One advantage of using a 1D convolution for this purpose is that it is a fairly simple operation, which makes it easy to implement and can be performed quickly. It also requires relatively little computational power, which makes it well-suited for use on devices with limited resources.
I have written a script in Python to demonstrate how this technique can be used in practice. To test your algorithm, you used a recorded video where the “stream” was simulated using a syringe without a detachable needle. By applying a 1D convolution to the image data, you were able to detect the movement of the “stream” and track its position over time.
Let’s see the demo.
Please, download the repo https://github.com/ser-mk/Pinect-MVP, prepare your environment according to the repo documentation, and run the script.
The video and white window are to be shown on screen. The script allows users to interact with a recorded video and visualize the results of a 1D convolution. By pressing the space key, users can play the video and see the convolution graph plotted on the screen. It is an ultra-narrow 1D convolution of the part of the image marked pink inside the green rectangle. Users can also create a new convolution area by pressing the ‘m’ key, drawing a rectangle using the right mouse button, and painting an area using the left mouse button. Press the space key to continue, and space again to play.
We can see how the graph changes over time due to the stream being moved on the screen. By subtracting two convolution graphs that are separated in time, you can identify the changes in the image data that correspond to the movement of the gamer’s stream.


The first convolution graph is the data of convolution for the image without the gamer stream, which only contains pissoir, the first cadr of video. The second is data for the image containing the gamer’s steam, which appears in the 63rd frame of the video.
 And their subtraction. Let’s look at it dynamically using the script. Run the script with the option “-a 30” and press the space key to continue.
As we can see in the graph window with the subtraction of convolution data, the sharp peaks on the graph are caused by the gamer’s stream position. This allows us to easily extract the signal of the gamer stream and understand how it affects the background of the image. However, it’s important to note that the presence of the gamer stream is not the only factor that can cause peaks in the convolution data. Sometimes the stream itself can produce multiple peaks, or extraneous signals can also contribute additional peaks, as shown in the attached graph below.

When analyzing the convolution data, it’s important to identify the most powerful peak in order to make informed decisions about the gamer stream position. One way to do this is by comparing the areas of the peaks, which effectively means calculating the integral of the peak function. By comparing the areas of the peaks, you can determine which peak is the strongest and therefore the most relevant for your analysis. This can help you extract the most important information from the convolution data and use it to optimize your streaming setup.

We will examine the graph of the integral of the peak function in relation to movement present in the video frame. To run the script, use the options “-a 30 -p” and press the space key.
The orange diagram represents the integral values, and by taking the greatest value, you can determine the position of the most powerful peak. Knowing the peak position on the graph allows you to locate the “stream” in the green rectangle of the image.
This algorithm allows us to accurately determine the position of a gamer’s stream. Despite being written in Python, it performs efficiently and effectively, making it suitable for use on low-performance and low-cost systems such as smartphones and microcomputers. In my next articles, it will be interesting to read about my experience creating an Android arcade game and the design of the finished device. I’m sure there will be valuable insights and tips for other developers.